Saturday 30 November 2013

Map of the Day 9: Feorad Isle

Welcome to week two of Map of the Day–the Calidar World Tour!
Feorad Isle, Calidar's northernmost land, Lambert Conformal Conic Projection
Feorad Isle – Calidar's northernmost land, Lambert Conformal Conic Projection

Feorad Isle, Calidar's northernmost land, Equirectangular Projection
Feorad Isle, First Draft
Equirectangular Projection
Feorad Isle, Calidar's northernmost land, Lambert Conformal Conic Projection
Feorad Isle, First Draft
Lambert Conformal Conic Projection
We begin our world tour this week with a look at the top of the world–the north pole.  There is no land at the pole itself, but there's an island close to it, which is known as Feorad Isle.  It's likely a cold, mostly frozen land, the vast majority of which lies firmly within the Arctic Circle – which on Calidar lies at 66.5ºN.

Continuing last week's discussion of projection problems, the north and south polar areas of any world pose a particularly thorny problem for world builders working with a rectangular base map, such as the Equirectangular Projection.  The problem is that areas north of 60ºN and south of 60ºS are stretched progressively more and more, until the single point of a pole is represented by the whole top or bottom edge of the map.

Feorad Isle, Calidar's northernmost land, Lambert Conformal Conic Projection
Feorad Isle, Second Draft
Lambert Conformal Conic Projection
Draw landforms in the normal way, and they will invariably end up spiky and squashed-looking.  You can see this in the first draft images on the left.  The solution is to reproject the map to a more suitable projection, and design the area using that projection.  Later, this can be projected back to Equirectangular and added back in to the base map – where of course it will now look stretched, but that's as it should be on that projection.

Feorad Isle, Calidar's northernmost land, Equirectangular Projection
Feorad Isle, Second Draft
Equirectangular Projection
The second draft black and white images show the fixed coastlines, first edited on a Lambert Conformal Conic Projection, then reprojected back to the base Equirectangular Projection.

It's important to consider projections when designing terrain, too, because otherwise the terrain will end up just as warped as the coastlines here were.  This is why each of Calidar's continents has been designed using a projection chosen for that continent.  The Great Caldera is circular, and away from the equator, so it uses the Stereographic Projection.  Feorad Isle is close to the north pole, and so could use Polar Stereographic, but the other side of the pole is uninteresting, with no land, so instead I chose the Lambert Conformal Conic, whose shape is very efficient in this case.


Feorad Isle, Calidar's northernmost land, mountain design, Lambert Conformal Conic Projection
Mountain Design
Lambert Conformal Conic Projection
Looking at these images again, I wonder if perhaps I have gone a little too far in reducing the spikiness of the terrain.  What do you think?  Please let me know in the comments.

After the coastlines have been fixed, it's time to build a height map, working from +Bruce Heard's mountain design.  In this case, the design was squished by the projection change, so it required quite a bit of tweaking; working in an appropriate projection is important not just for coastlines, but also for terrain design.  Even a long mountain range painted onto the Equirectangular projection maps above will be squashed down to a much shorter one when reprojected into Lambert Conformal Conic – or onto a globe.


Feorad Isle, Calidar, satellite view, pre-erosion terrain design, Lambert Conformal Conic Projection
Pre-erosion terrain design–satellite
Feorad Isle, Calidar 3D view, pre-erosion terrain design, Lambert Conformal Conic Projection
Pre-erosion terrain design–3D view


Once the base height map has been designed, it's time for simulated erosion.  In the 3D views here you can see the map in its initial design stage, then in its finished stage.  Note the very distinctive valleys carved into the land, and also how the blobby orange hills turn into sculpted peaks.


Feorad Isle, Calidar, satellite view, post-erosion terrain design, Lambert Conformal Conic Projection
Post-erosion terrain design–satellite
Feorad Isle, Calidar 3D view, post-erosion terrain design, Lambert Conformal Conic Projection
Post-erosion terrain design–3D view


As with the black and white coastline maps, the finished height maps are reprojected into Equirectangular form and added to the world map.  In this way, the world map is slowly taking form. Once its complete, we'll be able to produce accurate maps of any section of the world in whatever projection is needed.


Next time on our world tour, we will journey southwards to one of Calidar's biggest continents of all.

Friday 29 November 2013

Maps of the Day 4-8: Building the Mountains of the Great Caldera

After the coastlines, the mountains are probably the second most distinctive feature of most fantasy worlds.  Let's take a look at the development of the Great Caldera's mountains.


Great Caldera, Calidar, mountain design, Stereographic Projection
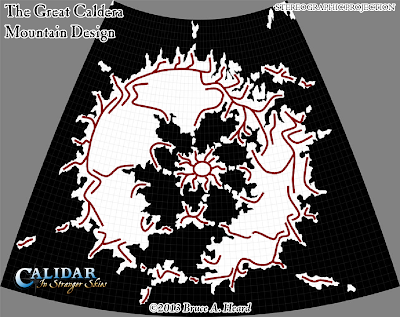
The Great Caldera Mountain Design, Stereographic Projection
The first image is +Bruce's design for the mountains of the Great Caldera, painted onto the Stereographic Projection from last time.  You can see how the mountain ranges generally follow the outside of the circle, forming a gigantic rim around the ancient impact crater.  Time has worn it down, and it is broken in a number of places.

Bruce drew these lines as guides for constructing a full height map (also known as a bump map, elevation map, or digital elevation model) of the area.  I took the lines, blurred them, messed them up a bit, and converted them into uneroded mountains.

Next, I took the same lines and expanded them out, then messing them up in a similar way to create hills.  
The second image is the resulting fully-detailed height map.


Great Caldera, Calidar, uneroded height map, Stereographic Projection
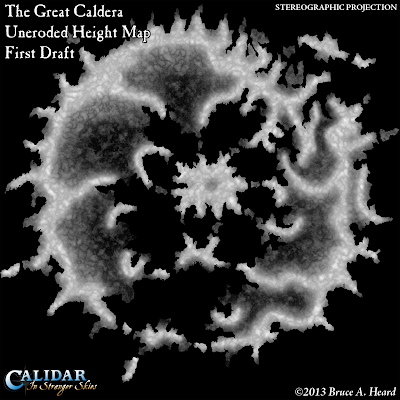
The Great Caldera Uneroded Height Map (First Draft)
Stereographic Projection
A word about height maps: this map shows elevations, with black being the lowest point – in this case, sea level – and white being the highest.  It takes some imagination to understand what's going on, but basically speaking the white points are mountain peaks, while the grey lines in between them are valleys, and the darker grey to almost black areas are hills and plains.

You may be wondering why such a map is necessary or even desirable.  The answer is that this map can be loaded into terrain viewer programs, which show it as a 3D model of the terrain.  Many computer games use these models to construct their worlds, and just as in those games, it's possible to move around and explore the landscape.
Height maps form the basis of all of Calidar's maps, and they open up exciting new possibilities for Calidar's cartography and art.  Their altitude data can be used in conjunction with latitude to calculate a simulated climate model, which in turn can even be used to texture the world according to each area's biome.  All of this is made possible by the height map, which is why I have spent more than four months so far building, eroding and refining Calidar's geography.

Great Caldera, Calidar, uneroded shaded height map, Stereographic Projection
The Great Caldera Uneroded Height Map (First Draft - Shaded)
Stereographic Projection
The third map, on the left, is exactly the same map, but instead of displaying low-to-high elevations as black-to-white, it uses a colour scheme to shade each height, making it a little easier to visualise what exactly is being depicted, but you have to bear in mind that the colours represent height variations, not terrain types.

Blue is sea level, light green-to-darker green is lowlands, light brown-to-dark brown is progressively higher areas, and dark brown-to-white is highlands.

Generally speaking, the lowlands are flatter than higher areas, so it's relatively safe to assume that green areas are lowland plains, or at most rolling hills.  But there could also be some lonely mountains in the green areas, too.

Now, you probably noticed that this height map (in both colour palettes) is labelled as being "uneroded".  That is to say, it has not undergone simulated erosion to carve mountains and valleys into those mounds.  This is a multi-stage process which takes anything from a few hours to a few days, depending on the size of the area and the resolution it needs to be done at.  This model is roughly 0.5 km per pixel at full resolution, and the full image is 9,999 x 9,998 pixels.  This provides a good level of detail for continental mapping, though perhaps not enough for country-level maps.

The fully eroded version of this map is the Great Caldera map with borders and labels which Bruce revealed in the initial announcement of the +World of Calidar, which you can see below.


Great Caldera, Calidar, eroded height map, Stereographic Projection
The Great Caldera Eroded Height Map (First Draft - Shaded), Stereographic Projection
Here it is: the first completed draft of the Great Caldera's fully eroded height map.  Compare it with yesterday's pre-erosion map, and you can plainly see how the white blobs have been carved into majestic white peaks.  What was previously a landscape of blobs has become a proper landscape of plains, hills, mountains and valleys.  A lot of land has disappeared during the erosion process, carried down to the lowlands and into the sea by simulated rain and water courses, which is why everything looks so much lower.

Taking a look at the geography of the Great Caldera, at this point it becomes very clear why its borders are located where they are: the political divisions follow natural divisions in the terrain, which split the land of the Caldera into numerous smaller areas.

Note that this is the first draft; there are various problems with this map, and in fact there have been another three passes since this map was completed.  I'm quite happy with the fourth draft, so it may well become the final one.

I'm sure many will be impressed with this, but I'm equally sure that some may be thinking: so what?  Why is this useful?  Why don't you stop talking about things and just show us the finished maps?

Don't worry, we'll get to some major reveals very soon.

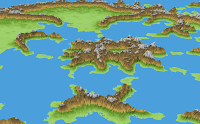
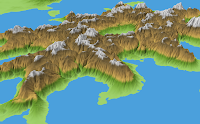
In the meantime, here are some 3D views of the terrain for your enjoyment.

Great Caldera, Calidar, 3D views of eroded height map, Stereographic Projection
Great Caldera, Calidar, 3D view of eroded height map, Stereographic Projection
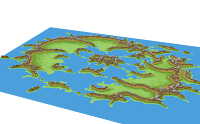
These very simple 3D views of the Great Caldera demonstrate the huge benefit of height maps, which is to say that they are really 3D models.  Using these very same height maps, it is possible to generate photorealistic-looking landscape views.
Great Caldera, Calidar, 3D view of eroded height map, Stereographic Projection
Great Caldera, Calidar, 3D view of eroded height map, Stereographic ProjectionBut for now, this is not our goal; the first priority is of course to establish the terrain and its shapes by producing high quality maps of the area.  The height maps help in this, too – not only by allowing the correlation of altitude and latitude data for climate shading, but also in generating river maps; in providing shaded relief for political maps; in guiding the creation of hex maps; and other ways besides.  I hope you can see why I have chosen to develop Calidar's terrain in this way.

The shading you see here is the same simple, elevation-based shading as on the colour maps above.  Note how the flat map's colours have been adopted into the 3D view.  It's actually possible to load any image as a texture for the 3D model, so even without photorealistic rendering, you can expect to see more of these 3D views – and prettier ones, too.

More about all of this later.  This brings us to the end of our first week of Maps of the Day, exploring the Great Caldera, the heart of the World of Calidar.  Thanks for reading!  Join us again next week as we preview the shape of the Dread Lands which lie outside the relative safe haven of the Great Caldera.

Thursday 28 November 2013

Maps of the Day 1-3: Mapping the Great Caldera

Welcome to the Calidar Map of the Day series!  In this series of posts, I will be sharing a pre-production or work-in-progress map every day to preview my work on +Bruce Heard's upcoming setting, the +World of Calidar, which I am involved in as cartographer.


Great Caldera, Calidar, Equirectangular Projection
The Great Caldera, Equirectangular Projection
Our journey through Calidar begins with the Great Caldera – the heart of the setting, and the most settled region on the planet.

The result of a massive collision in Calidar's ancient history, the Great Caldera is a perfect circle with a mountainous rim.  This presents a unique mapping challenge: drawing a circle on a sphere is easy, but the rectangular map projections usually used to design worlds are another matter entirely.

The 2:1 latitude/longitude grid known as Equirectangular, Plate Carrée, or simply Geographic Projection is very useful because it is easily applied to 3D spherical models, such as Google Earth.  But the further north or south you go, the more stretched it becomes, until the entire top and bottom lines of the map represent the single points of the poles.

The Great Caldera stretches from 25º to 65ºN, putting the northern part of the Caldera in an area which is very susceptible to these distortions.

Look closely at the first map.  Does it look like a perfect circle to you?  Probably not.  But in fact it is a perfect circle when viewed on a globe.


Great Caldera, Calidar, Stereographic Projection
The Great Caldera, Stereographic Projection
This companion map shows the exact same coastal outlines as the first map, but using a more suitable projection for a circular area.

The Stereographic Projection is particularly appropriate for the Great Caldera, because it shows any circle on the globe as a circle on the map.

If we had just drawn a circle on the Equirectangular Projection base map, it would have ended up being deformed when viewed on a globe.  These days, when it's very easy to set up Google Earth or a number of other programs to display interactive globes in the computer, it was a design priority to get these projection issues right from the start.

Getting back to the map, you can see how the perfect circle of the Great Caldera has collapsed and decayed at various points.  We'll take a look at the design phase for the mountains encircling the Caldera in the next post.


Great Caldera, Calidar, wrong version, Equirectangular and Stereographic Projections
The Great Caldera (Uncorrected Version), Equirectangular and Stereographic Projections
The first two maps showed the final, corrected version of the Great Caldera.  It only looks circular in the Stereographic Projection, of course, but place the Equirectangular Projection on Google Earth and it will become circular again.

This last map predates the first two, showing the same design for the Great Caldera, this time as a political map showing borders and country names.  The inset shows Bruce's original design, which we did on an Equirectangular Projection (as many mappers do, since it allows the aforementioned use of Google Earth).  It looks fine – a perfect circle.  The problem with this is that when it is applied to a globe or other 3D spherical model, the Caldera's shape is deformed, appearing more like it looks in the Stereographic Projection.

So the first two maps above are the result of a proper implementation of this design, as Bruce originally intended it to look.  One last map to illustrate my point: this rendering of the globe of Calidar was made using an Equirectangular Projection world map.  Note how the Great Caldera looks nice and circular, as it is supposed to.
Calidar, Great Caldera, Mareas, Ule, Taslan, Eerien, Laëril, Equirectangular Projection, render of globe
The World of Calidar, Orthographic Projection (also known as "View from Space")
We will continue to look at the effect map projections have on the shapes of Calidar's landforms over the next few weeks.  But before that, let's delve a little deeper into the terrain design, starting with the mountains, and then moving on to height maps.